The manual determination of a threshold value is tedious and subjective.
This is problematic as it reduces the reproducibility of the results and may preclude determining threshold values for many different images as the dataset becomes large. It is therefore important to know about reproducible mathematical approaches to automatically determine threshold values for image segmentation.
Prerequisites
Before starting this lesson, you should be familiar with:
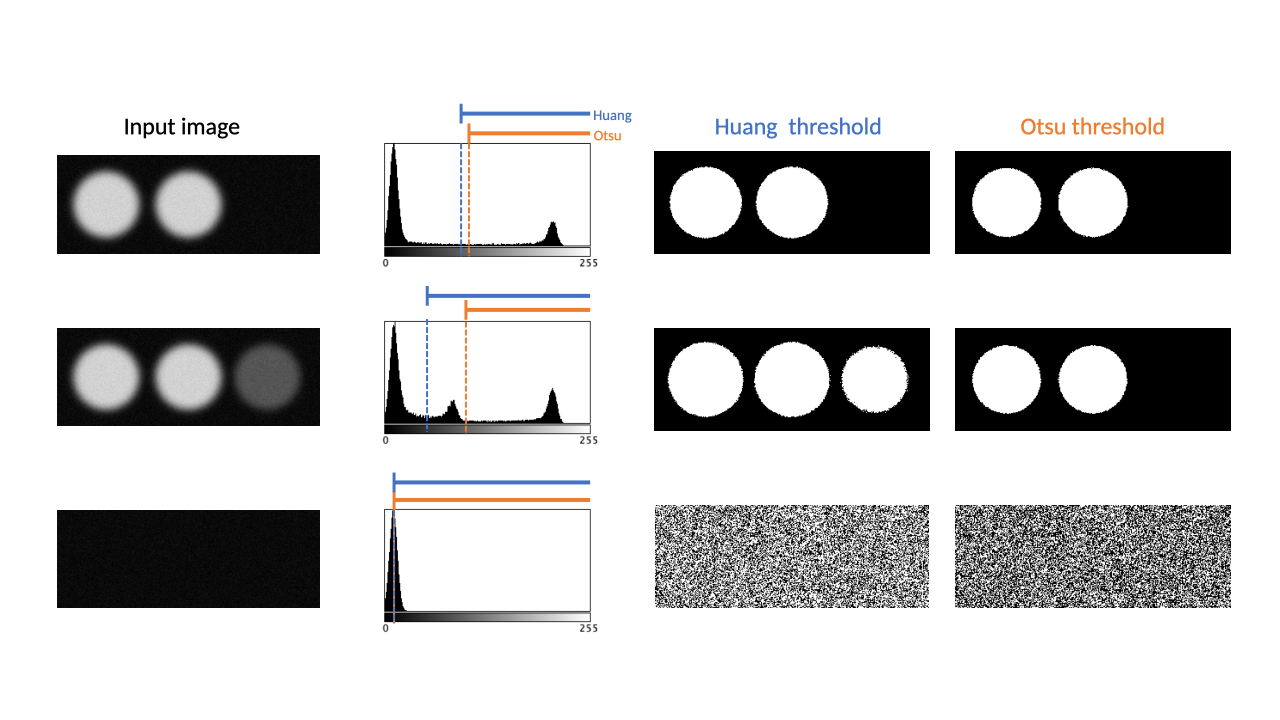
In auto thresholding several methods produce acceptable results and one can get rid of selecting manual threshold values for each different image
skimage napari
# %%
# Apply manual and automated thresholds
# %%
# initial imports
importnapariimportnumpyasnpfromOpenIJTIFFimportopen_ij_tiff# %%
# Read two images
image1,*_=open_ij_tiff('https://github.com/NEUBIAS/training-resources/raw/master/image_data/xy_8bit__nuclei_without_offset.tif')image2,*_=open_ij_tiff('https://github.com/NEUBIAS/training-resources/raw/master/image_data/xy_8bit__nuclei_with_offset.tif')# %%
# Inspect image data type and value range
print(image1.dtype,image1.shape,image1.min(),image1.min())print(image2.dtype,image2.shape,image2.min(),image2.max())# %%
# Instantiate the napari viewer and display the images
viewer=napari.Viewer()# %%
# Add the images
viewer.add_image(image1,name="image1")viewer.add_image(image2,name="image2")# %%
# Show the histogram
importmatplotlib.pyplotaspltplt.hist(image1.flatten(),bins=np.arange(image1.max()+1),log=True);plt.hist(image2.flatten(),bins=np.arange(image2.max()+1),log=True);# %%
# Try manual thresholding
thr1=25thr2=75manual_thresholded1=image1>thr1manual_thresholded2=image2>thr2viewer.add_labels(manual_thresholded1,name='manual_thresholded1',opacity=0.4)viewer.add_labels(manual_thresholded2,name='manual_thresholded2',opacity=0.4)# Identify possible problems with this solution
# %% [markdown]
# Explore auto-thresholding options on:
# https://scikit-image.org/docs/stable/api/skimage.filters.html
# %%
# Obtain the thresholding values
fromskimage.filtersimportthreshold_meanthr1=threshold_mean(image1)print(thr1)mean_thresholded1=image1>thr1thr2=threshold_mean(image2)print(thr2)mean_thresholded2=image2>thr2# %%
# Visualize auto-thresholded images
viewer.add_labels(mean_thresholded1,name='mean_thresholded1',opacity=0.4)viewer.add_labels(mean_thresholded2,name='mean_thresholded2',opacity=0.4)# %%
# Explore other thresholding options
# Note that there exists a threshold_multiotsu function to handle cases with multi-peaks histograms
# %%
# Close the viewer (CI test requires this)
viewer.close()plt.close('all')
Observe that the different methods give different outputs
Appreciate that this montage view is not suited for further analysis of the binary output
Apply one method to properly segment the stack, e.g. Otsu
[ Image > Duplicate… ]
Title = Otsu
[X]Duplicate stack
[ Image > Adjust > Auto Threshold ]
Method = Otsu
[X]Stack
[X]Use stack histogram
[X]Show threshold values in log window
Press OK
skimage napari
# %% [markdown]
# ## Apply automated thresholds in 3D
# %%
# initial imports
importnumpyasnpimportnaparifromOpenIJTIFFimportopen_ij_tiff# %%
# Read the images
image,axes,scales,units=open_ij_tiff('https://github.com/NEUBIAS/training-resources/raw/master/image_data/xyz_8bit__nuclei_autothresh.tif')# %%
scales# %%
# Inspect image data type and values
print(f'Type: {image.dtype}\nShape: {image.shape}\nMin: {np.min(image)}\nMax: {np.max(image)}')# %%
# Instantiate the napari viewer and display the image
viewer=napari.Viewer()viewer.add_image(image,name='image',scale=scales)# %%
# Obtain threshold value using Otsu's algorithm
fromskimage.filtersimportthreshold_otsuthresholded_otsu=image>threshold_otsu(image)viewer.add_labels(thresholded_otsu,name='otsu',colormap={None:None,1:'green'},scale=scales)# %% [markdown]
# **Napari GUI** Explore the results in the napari viewer. For 3D data one can change the order
# of visible axes (bottom left in napari viewer window). If not satisfied by the
# results, we can explore other threshold algorithms
# %%
# Additional threshold methods
fromskimage.filtersimportthreshold_lithresholded_li=image>threshold_li(image)viewer.add_labels(thresholded_li,name='li',colormap={None:None,1:'orange'},scale=scales)# %%
# Close the viewer (CI test requires this)
viewer.close()
Assessment
True or False
Using stack histogram yields only one threshold value for binarization when applying auto thresholding
Auto thresholding gives better segmentation results than manual thresholding in the presence of noise