Point spread function
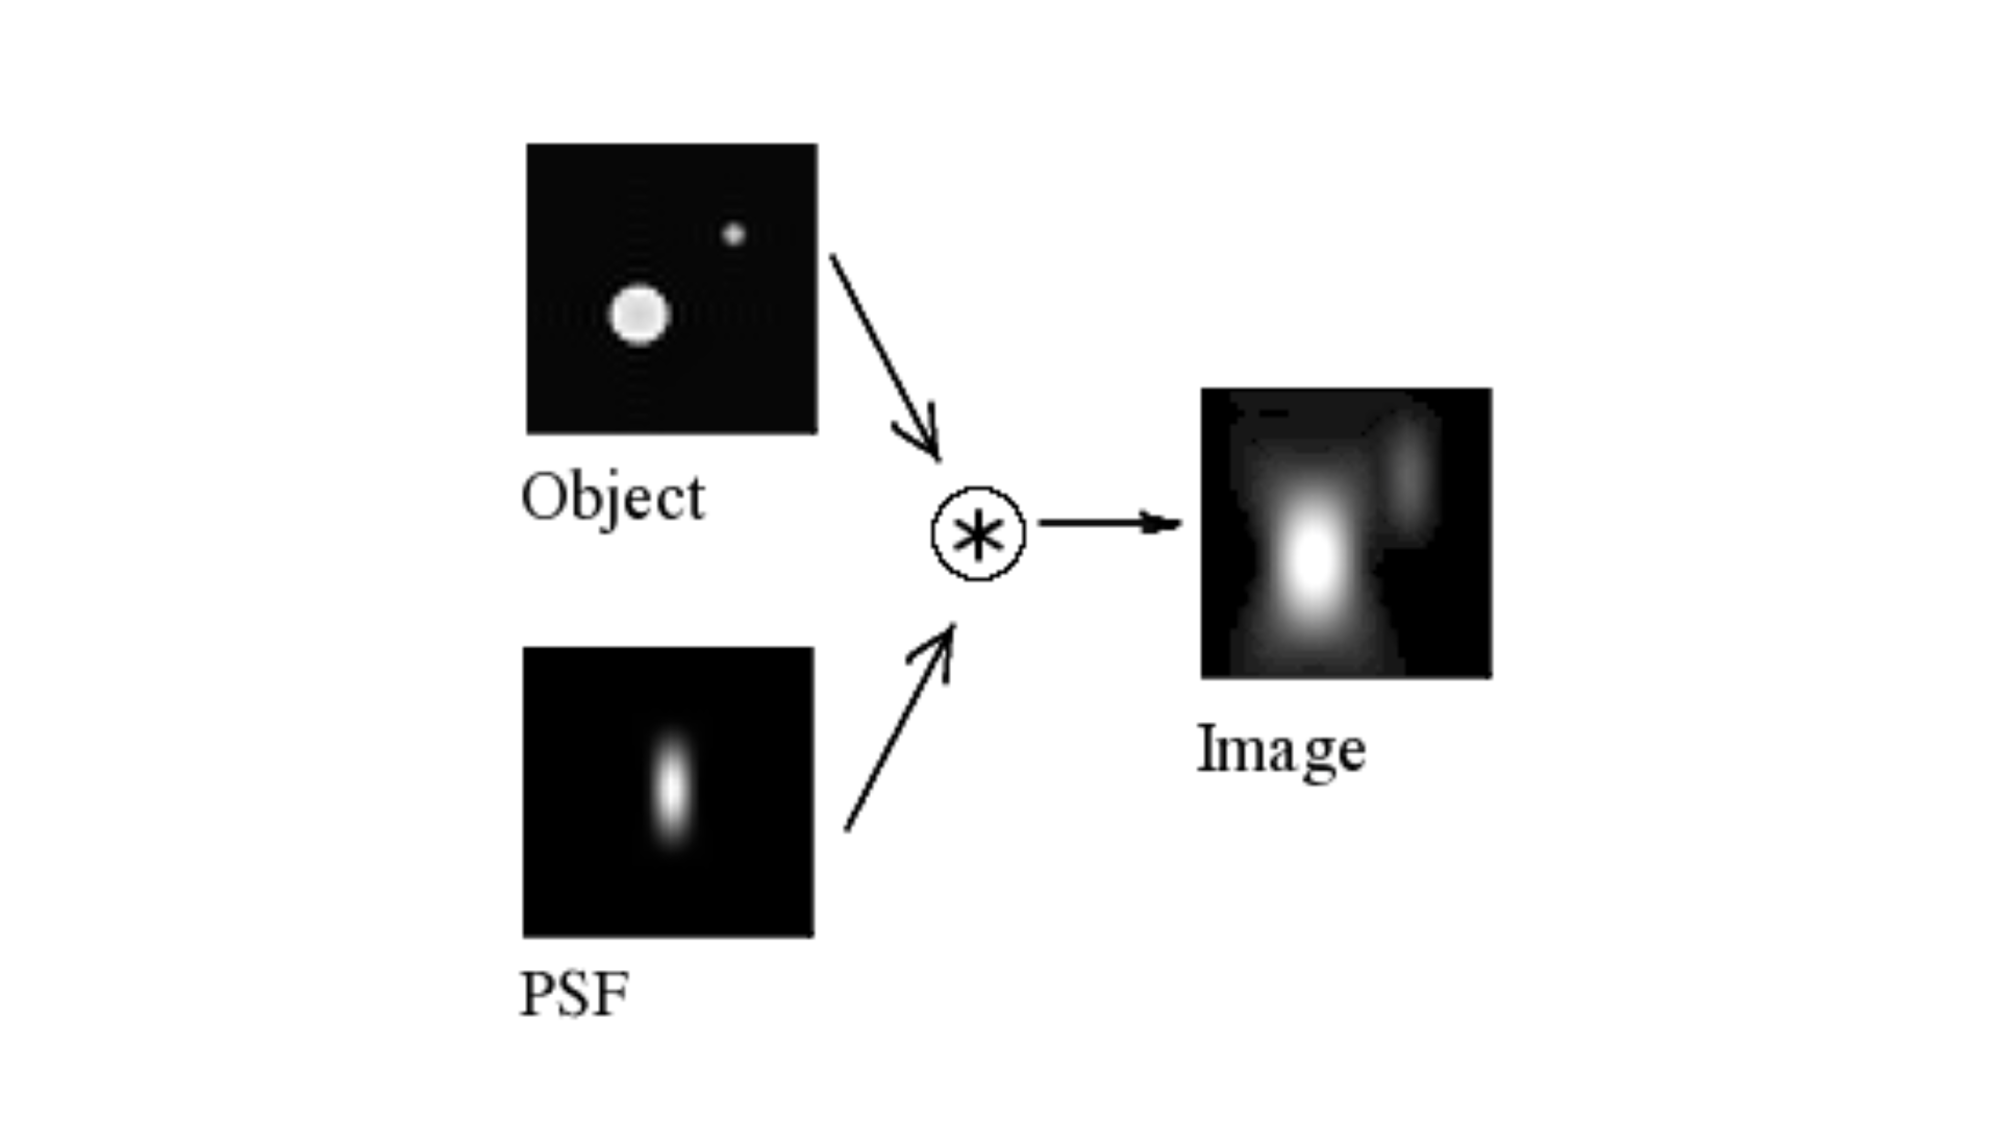
In microscopy, what you see is never exactly what is actually there. The Point Spread Function (PSF) is the fundamental reason for this discrepancy. Think of the PSF as the “signature” of your microscop — it describes how the system takes a single, infinitesimal point of light and smears it into a 3D diffraction pattern. If you are doing quantitative microscopy (measuring intensity, size, or distance), ignoring the PSF is like trying to do carpentry with a ruler that changes length depending on where you stand.
Prerequisites
Before starting this lesson, you should be familiar with:
Learning Objectives
After completing this lesson, learners should be able to:
Identify PSF-induced artifacts in microscopy images, specifically axial elongation (Z-distortion) and lateral blurring.
Predict the impact of the PSF on quantitative measurements, including how it inflates object size and dilutes signal intensity.
Understand how microscope hardware configurations change the PSF.
Concept map
Figure
Activities
Explore the confocal 3-D PSF of beads: in two colors and with open and closed pinhole
Completely spherical objects appear very different (i.e. non-spherical) in a fluorescence microscope if their size approaches the diffraction limit. This appearance not only depends on microscope settings like a confocal pinhole, but also their fluorescence color. If your research is concerned with objects of such a small size (a few hundred nanometer), it is of critical importance to understand these distortions in order not to mistake them for biologically meaningful shapes.
- Open xyzc_8bit_beads_p_close.tif (closed pinhole) and xyzc_8bit_beads_p_open.tif (open pinhole).
- Observe that both images contain two channels, where beads of the same physical size but with different fluorescence have been imaged.
- Inspect the measured shapes in 3-D and also measure the full width half maximum (FWHM) in the XY plane for all the conditions (open, close, green, red).
Show activity for:
ImageJ GUI
TODO
Assessment
Fill in the blanks
- In fluorescence microscopy, the PSF causes an apparent increase in object _____ and a decrease in peak _____. This is most pronounced for structures with a physical size below _____ .
- The PSF is typically elongated along the _____ axis, which explains why structures often appear stretched in that direction in 3D microscopy images.
Solution
- In fluorescence microscopy, the PSF causes an apparent increase in object size and a decrease in peak intensity. This is most pronounced for structures with a physical size below one micrometer.
- The PSF is typically elongated along the z axis, which explains why structures often appear stretched in that direction in 3D microscopy images.
Follow-up material
Recommended follow-up modules:
Learn more: