After completing this lesson, learners should be able to:
Understand the basic principle of a neighborhood filter.
Apply basic neighborhood filters to an image.
Motivation
Images are quite often noisy or have other issues that make them hard to segment, e.g. by means of a simple intensity threshold. Neighborhood filters are often used to enhance the images in order to facilitate better performance of segmentation algorithms.
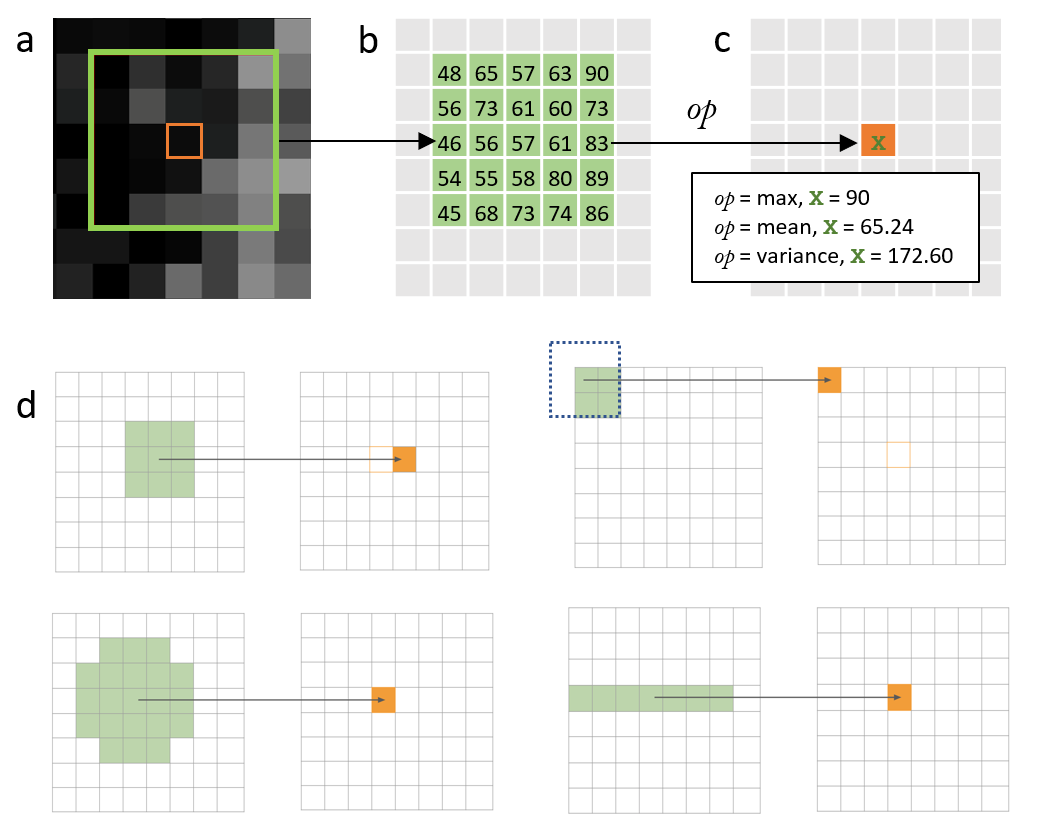
Image filtering with a pixel neighborhood. (a) Raw intensity image with pixel neighborhood (structuring element (SE), outer green box) and central pixel (inner orange box) on which the filtering operation will be performed. (b) Pixel values in the neighborhood. (c) X is the value that would be replaced after operation (indicated as op). Here, max, mean and variance operations are used. Note - One has to carefully look at the data type of the image as some operations can produce large/floating point values. (d) Different SEs (neighborhood in green and affected pixel in orange) top left - SE completely inside image boundaries; top right - SE at image boundaries (padding needed); bottom left - SE with different shape; bottom right - Line SE.
It is helpful to first duplicate the image: [Image > Duplicate…] or [Ctrl-Shift-D]
Title = mean_1
Apply a mean filter to the image such that you can binarize the image into exactly three disjoint foreground regions (the three nuclei). The resulting mask should look like xy_8bit_binary__nuclei_very_noisy.tif
[Process > Filters > Mean…]
Radius = 1 pixels
[Image > Adjust > Threshold…]
Dark Background
Lower threshold level = 31
Higher threshold level = 255
Press Set
Press Apply
[Image > Lookup Tables > Invert LUT]
Repeat the procedure with radii = 2, 5, 7
What is the smallest size for the mean filter that does the job?
Radius = 2 pixels and Lower threshold level = 30 (other values can also be chosen) can remove the noise and find the appropriate nuclei size after manual thresholding
# %%
# Apply mean filters to an image to aid foreground background segmentation
# %%
# Instantiate the napari viewer
importnaparifromOpenIJTIFFimportopen_ij_tiffviewer=napari.Viewer()# %%
# Read the intensity image
image,*_=open_ij_tiff('https://github.com/NEUBIAS/training-resources/raw/master/image_data/xy_8bit__nuclei_very_noisy.tif')# %%
# View the image
# - Appreciate that it is quite noisy
# - Inspect the pixel values to find a threshold that separates the nuclei from the background
viewer.add_image(image)# %%
# Binarise the image
# - Appreciate that one cannot segment the nuclei by a simple intensity threshold
binary_image=image>40viewer.add_image(binary_image)# %%
# Prepare filtering the image by defining a circular structural element with a radius of 1 pixel
fromskimage.morphologyimportdiskdisk_radius_1=disk(1)print(disk_radius_1)# %%
# Apply a mean filter to the image with the above structural element
fromskimage.filters.rankimportmeanmean_image_1=mean(image,disk_radius_1)# Add the filtered image to napari
# Napari:
# - Zoom in and inspect the pixel values to check that the filtered image indeed contains the local mean values of the raw image
viewer.add_image(mean_image_1)# %%
# Binarise the filtered image
# - Appreciate that one still cannot readily segment the nuclei
binary_image_1=mean_image_1>35viewer.add_image(binary_image_1)# %%
# Apply mean filter with a disk of radius 3
mean_image_3=mean(image,disk(3))viewer.add_image(mean_image_3)# %%
# Now the nuclei can be segmented by a simple threshold :)
binary_image_3=mean_image_3>32viewer.add_image(binary_image_3)
Apply a variance filter [ Process > Filter > Variance… ] to segment the cell regions from the background
Hints:
Convert image to float, because the filter may yield high values [ Image > Type > 32-bit ]
What filter radius and threshold yield a good segmentation?
Solution
[ Image › Rename…]
Title = input
[ Image › Duplicate… ]
Title = variance_5
[ Image > Type > 32-bit ]
In variance calculation, pixel values can exceed 255 which is the maximum value that can be achieved in current bit depth (unsigned 8-bit) of input image.
[ Process › Filters › Variance… ]
Radius = 15 pixels
[ Image › Adjust › Threshold… ]
([x] Dark Background)
Lower threshold level = 1.5
Higher threshold level = 1e30
Press Set
Press Apply
Press Convert to Mask
ImageJ Macro
// File > Close All
run(“Close All”);
// File > Open…
open(“C:/Users/akhan/training-resources/image_data/xy_8bit__em_mitochondria_er.tif”);
//Press Set button (example upper and lower threshold values are (113, 255))
setThreshold(113, 255);
// Press Apply button
run(“Convert to Mask”);
// Image › Lookup Tables › InvertLUT… (if highest values are darker and lowest brighter)
run(“Invert LUT”);
skimage napari
# %%
# Apply variance filters to an EM image to aid foreground background segmentation
# %%
# Import libraries and
# instantiate the napari viewer
importnumpyasnpimportnapariimportmatplotlib.pyplotaspltfromOpenIJTIFFimportopen_ij_tiffviewer=napari.Viewer()# %%
# Read the image and add it to napari
# - Try to find an intensity threshold that separates the intracellular region from the bright background
image,*_=open_ij_tiff('https://github.com/NEUBIAS/training-resources/raw/master/image_data/xy_8bit__em_mitochondria_er.tif')viewer.add_image(image)# %%
# Plot an intensity histogram as another way to find a threshold
plt.hist(image.flatten(),bins=np.arange(image.min(),image.max()+1))# %%
# Appreciate that a simple threshold does not suffice to distinguish the cytoplasm from the bright background outside the cell
binary_image=image<230viewer.add_image(binary_image)# %%
# Apply a variance filter to separate the two regions
# - The idea is to make use of the fact that the background had less local intensity variations than the cytoplasm
# - Note that a mean filter might also work here (please try), but we want to learn something new
# %%
# Convert to uint16 to be able to accommodate
# the square of the unit8 image, which is needed to represent the variance
# - Appreciate that such datatype issues are common applying any kind of "image math"
print(image.dtype)uint16_image=image.astype(np.uint16)print(uint16_image.dtype)# %%
# View the uint16 image in napari and check whether the datatype conversion changed the pixel values
# - Going from a lower bit-depth to a higher bit-depth should normally not change the values
viewer.add_image(uint16_image)# %%
# We could not find a function to directly compute the local variance of an image,
# thus we introduce a, very useful, generic approach to compute any kind of local neighborhood
# filter
# import the generic filter function
fromscipy.ndimageimportgeneric_filter# apply the generic filter with a variance computation
var_image=generic_filter(uint16_image,function=np.var,size=11)# %%
# View the variance filtered the image to napari
# Look for a threshold that separates the cell from the background
viewer.add_image(var_image)# %%
# Also inspect the histogram to find a threshold
# - It is interesting to compare the histograms of the variance images computed
# with different filter widths, to see how well there are two populations of intensity values
plt.hist(var_image.flatten(),bins=np.arange(var_image.min(),var_image.max()+1))plt.yscale('log')# %%
# Segment the cellular region by applying a threshold to the variance filtered image
# - It can be interesting to also try some auto-threshold method here
binary_var_image=var_image>100viewer.add_image(binary_var_image)
Assessment
Fill in the blanks
Fill in the blanks, using these words: decrease, increase, size, structuring element, large
A synonym for neighborhood is __
The filter radius characterize the filter ___
___ filter size can cause a loss of details in the filtered image
Filter can be used to __ the noise in an image
The usage of filters can __ the quality of image segmentation/binarization
Solution
A synonym for neighborhood is structuring element (SE)
The filter radius characterize the filter size
large filter size can cause a loss of details in the filtered image
Filter can be used to decrease the noise in an image
The usage of filters can increase the quality of image segmentation/binarization
Explanations
Neighborhood filters comprise two ingredients: a definition of the pixel neighborhood (size and shape) and a mathematical recipe what to compute on this neighborhood.
The result of this computation will be used to replace the value of the central pixel in the neighborhood. This procedure can be applied to several (all) pixels of an image to obtain a filtered image. The animation shows a square neighborhood (3x3) applied to the inner pixels of the image.
There are tons of different neighborhood filters, and you can also invent one!
The neighborhoods
The neighborhood of a pixel is also called a structuring element (SE) and can have various sizes and shapes.
Here, we use one of the simplest and most widely used neighborhoods, namely a circular neighborhood, which is defined by a certain radius. We will explore other shapes of SEs in more detail in a dedicated module.
Padding
Since the filtering operation takes into account all the directions of extent of SE, border pixels would be affected in a different way and one has to decide that which values they should assume. Padding is the operation of adding an additional layer around your data to get more accurate values after filtering process. It also gives you option to retain same dimensions for your data after filtering. Common padding methods are using zeros or to mirror/replicate the border pixel values.
The math
There are many ways how to cleverly compute on a pixel neighborhood. For example, one class of computations is called convolutional filters, another is called rank filters. Here, we focus on the relatively simple mean and variance filters.
Best practice
As usual, everything depends one the scientific question, but maybe one could say to use a filter that changes the image as little as possible.