For scientific discovery using microscopy it is critical to be able quantitatively inspect and present bioimaging data. This is important at many stages, ranging from looking at the data yourself, presenting the data to lab members and finally creating a figure for a publication.
Prerequisites
Before starting this lesson, you should be familiar with:
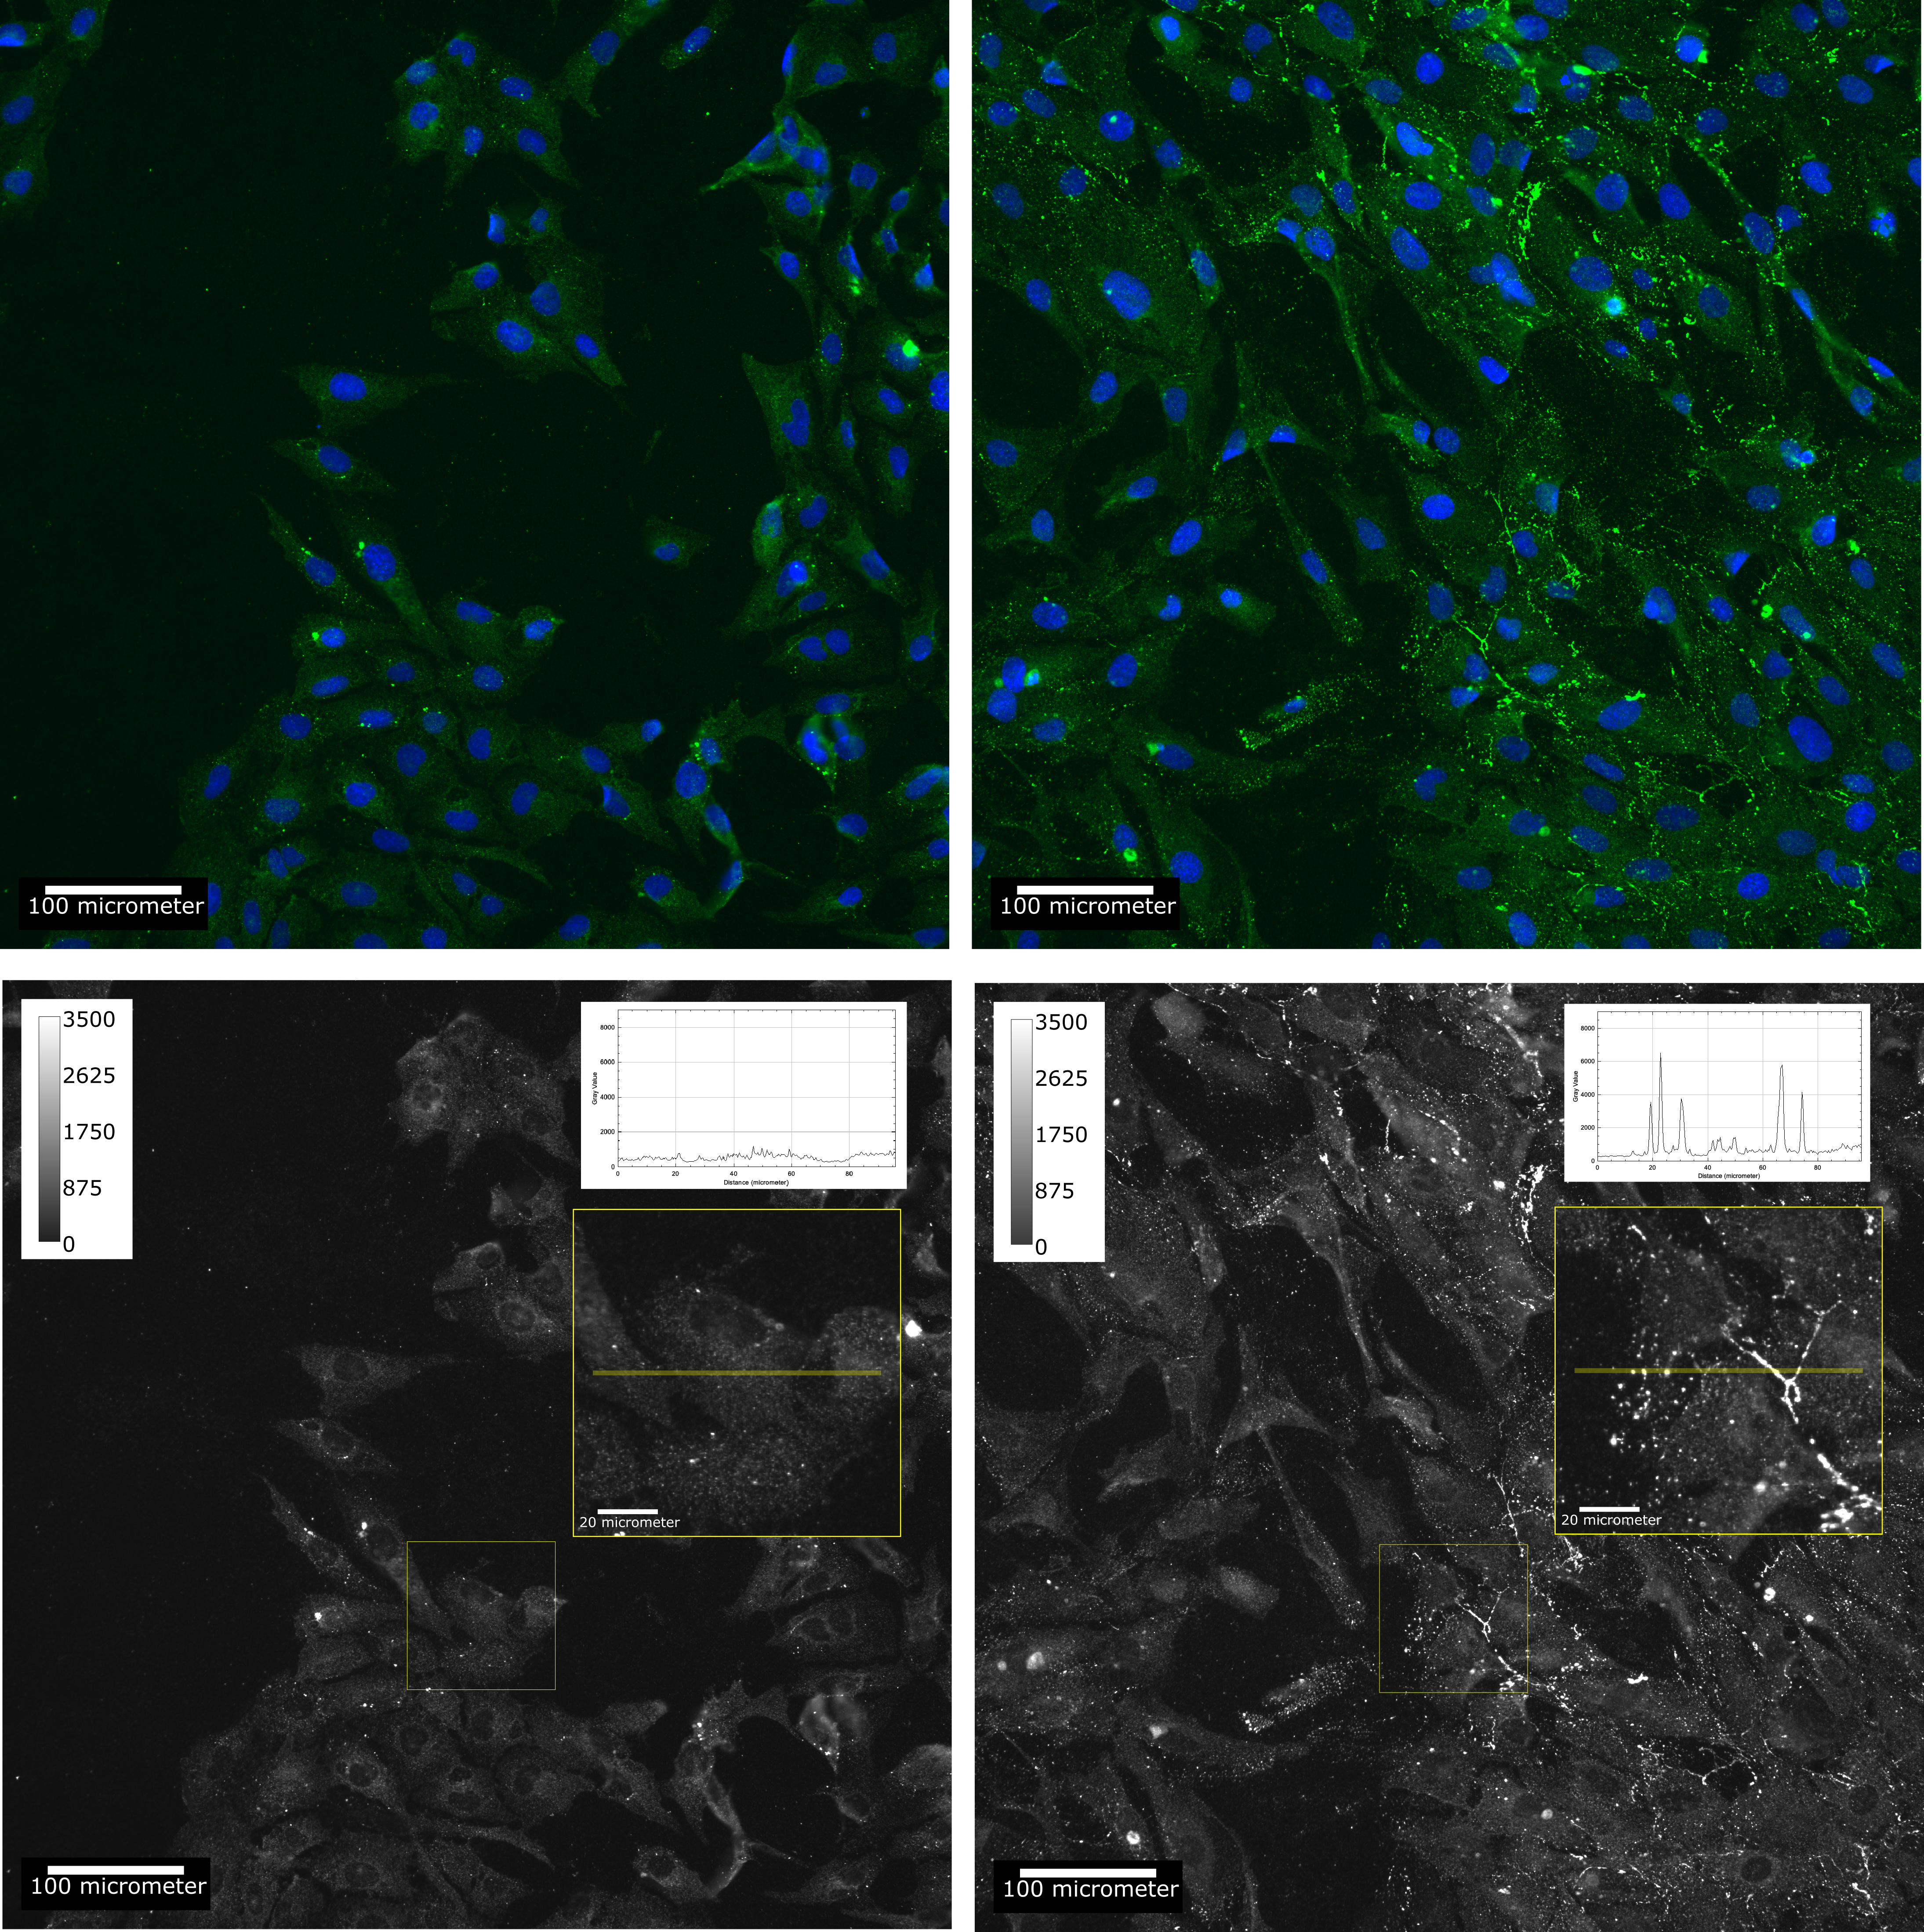
This activity opens images where tissue culture cells are secreting collagen for different amounts of time.
The aim is to display the images such that one can appreciate that after 96 h there is more collagen
secreted than after 0 h. The aim is to make this display as quantitative as possible without doing an actual
image analysis.
Requirements:
BioVoxxel Fiji Update site for saving images as SVG vector graphics
NOTE (IMPORTANT): Please update to include BioVoxxel plugin (using Help > Update > Manage update sites) before proceeding to the activity
Show activity for:
ImageJ Macro
/*
* This ImageJ Macro opens images where tissue culture cells are secreting collagen for different amounts of time.
* The aim is to display the images such that one can appreciate that after 96 h there is more collagen
* secreted than after 0 h. The aim is to make this display as quantitative as possible without doing an actual
* image analysis.
*
* Requirements:
* - BioVoxxel Fiji Update site for saving images as SVG vector graphics
*
*/run("Close All");viewImage("https://github.com/NEUBIAS/training-resources/raw/master/image_data/image_inspection_and_presentation/xy_16bit__0h_dapi.ome.tif","https://github.com/NEUBIAS/training-resources/raw/master/image_data/image_inspection_and_presentation/xy_16bit__0h_collagen.ome.tif","0h",1655,958,1928,961);viewImage("https://github.com/NEUBIAS/training-resources/raw/master/image_data/image_inspection_and_presentation/xy_16bit__96h_dapi.ome.tif","https://github.com/NEUBIAS/training-resources/raw/master/image_data/image_inspection_and_presentation/xy_16bit__96h_collagen.ome.tif","96h",945,1446,1218,1449);// save all images as SVG for creating a figure in software such as PowerPoint or Inkscape// CHANGE the outputFolder!!!outputFolder="/Users/tischer/Documents/training-resources/image_data/image_inspection_and_presentation/figure_creation_images";setOption("ScaleConversions",true);run("Export all images as SVG","folder=["+outputFolder+"] exportchannelsseparately=Color interpolationrange=0.0 locksensitiverois=true");functionviewImage(dapiPath,collagenPath,treatment,px0,py0,px1,py1){// Open collagen imageopen(collagenPath);rename(treatment+"_collagen");// Adjust and display LUTsetMinAndMax(0,3500);run("Calibration Bar...","location=[Upper Left] fill=White label=Black number=5 decimal=0 font=12 zoom=4 overlay");// Adjust and display spatial calibration// - in this case the pixel calibration is missing from the image metadata, thus we need to add it herecameraPixelSize=6.45// micrometermagnification=20imagePixelSize=cameraPixelSize/magnificationrun("Properties...","pixel_width=imagePixelSize pixel_height=imagePixelSize");Stack.setXUnit("micrometer");Stack.setYUnit("micrometer");run("Scale Bar...","width=100 height=1 thickness=20 font=50 background=Black location=[Lower Left] overlay");// Open DAPI image open(dapiPath);rename(treatment+"_dapi");setMinAndMax(0,4000);// Create merged imagerun("Merge Channels...","c2="+treatment+"_collagen c3="+treatment+"_dapi create keep ignore");rename(treatment+"_composite");// run("Calibration Bar...", "location=[Upper Left] fill=White label=Black number=5 decimal=0 font=12 zoom=4 overlay"); // ERRORrun("Scale Bar...","width=100 height=1 thickness=20 font=50 background=Black location=[Lower Left] overlay");// Create zoom in collagen imageselectWindow(treatment+"_collagen");makeRectangle(921,1278,337,337);run("Add Selection...");// keep as overlayrun("Duplicate...",treatment+"_collagen_zoom");run("Scale Bar...","width=20 height=0 thickness=5 location=[Lower Left] overlay");run("Select All");// to create an image boundaryrun("Add Selection...");// keep as overlay// Create line profile in the middle of the zoommakeLine(20,getHeight()/2,getWidth()-20,getHeight()/2);run("Add Selection...");// keep as overlayrun("Plot Profile");Plot.setLimits(0.0,95.8,0,9000);// Close images that are not neededselectImage(treatment+"_dapi");close();}
Adjust the display range of both images using Image > Adjust > Brightness/Contrast...
Try to select an intensity range for control image and then use the same min and max values for the treatment image
This can be done using the Set button of the B&C window. This will open another window Set Display Range. As an example, set Minimum displayed value and Maximum displayed value to 0 and 3500 respectively and select [x] Propagate to all other open images and press OK
If metadata is missing, add it manually to both images
Open Image > Properties...
Set Pixel width and Pixel height to 0.324micron
Add calibration bar to both images using Analyze > Tools > Calibration Bar...
Adjust the display range of both images using Image > Adjust > Brightness/Contrast...
Use Set button of B&C and set Minimum displayed value and Maximum displayed value to 0 and 4000 respectively and select [x] Propagate to all other open images and press OK
Merge channels belonging to the same image (e.g. “*_0h_collagen.ome.tif” belongs to “*_0h_dapi.ome.tif”) using Image > Color > Merge Channels.... and in the settings:
Set collagen channel as C2(green)
Set dapi channel as C3(blue)
[x] Create composite
[x] Keep source images
Add scale bar to each image using Analyze > Tools > Scale Bar... and increase Thickness in pixels and Font size to suit your needs
Thickness in pixels - 20
Width in um - 100
Font size - 50
Location - Lower left
[x] Overlay
Close dapi single channel image windows
Select Rectangle tool from Fiji GUI, and select an ROI on 0h_collagen image (grayscale)
Add it as overlay on the image using Image > Overlay > Add Selection...
Duplicate the selection to create an ROI image using Image > Duplicate...
[] Ignore selection
Note: The overlay box stays on the original image even if you click elsewhere
Add scale bar to ROI image using Analyze > Tools > Scale Bar... and reduce Thickness in pixels and Font size to suit your needs
Select a Line tool from Fiji GUI, and draw a line in the middle of ROI image
Add it as an overlay on the image using Image > Overlay > Add Selection...
Plot intensity profile along this line using Analyze > Plot Profile
Set the y-axis range using Set>> Set Range...
Set YFrom to 0 and YTo to whatever number and press OK
Select Rectangle tool from Fiji GUI, and select an ROI on 96h_collagen image (grayscale) and repeat the procedure above
Note: You can use the same ROI as above by selecting the ROI rectangular box on 0h_collagen image and then selecting 96h_collagen image and doing Edit > Selection > Restore Selection
To save all the images in the high quality, go to Plugins > BioVoxxel Figure Toolbox > Export all images as SVG
Target folder - folder of your choice to save all SVG images