Finding objects/regions of interest in an image is one of the most common goals in image analysis. Since an image is an array of pixel values, one can assign certain pixel values to objects/regions of interest. One strategy to achieve this, is to first distinguish so-called background pixels, which do not contain objects or interesting regions from foreground pixels, which mark the areas of interest, by means of a single threshold value. This process is called two class semantic segmentation and is often referred to as image binarization. The foreground regions can then be further processed, e.g. to detect objects or perform intensity measurements.
Prerequisites
Before starting this lesson, you should be familiar with:
After completing this lesson, learners should be able to:
Describe the relationship between an intensity image and a derived binary image
Apply threshold to segment an image into foreground and background regions
Concept map
graph TD
I("Image") --> T("Threshold (value)")
T --> BI("Binary image / Binary mask")
BI --- BG("Background pixels (false, 0)")
BI --- FG("Foreground pixels (true, 1, 255)")
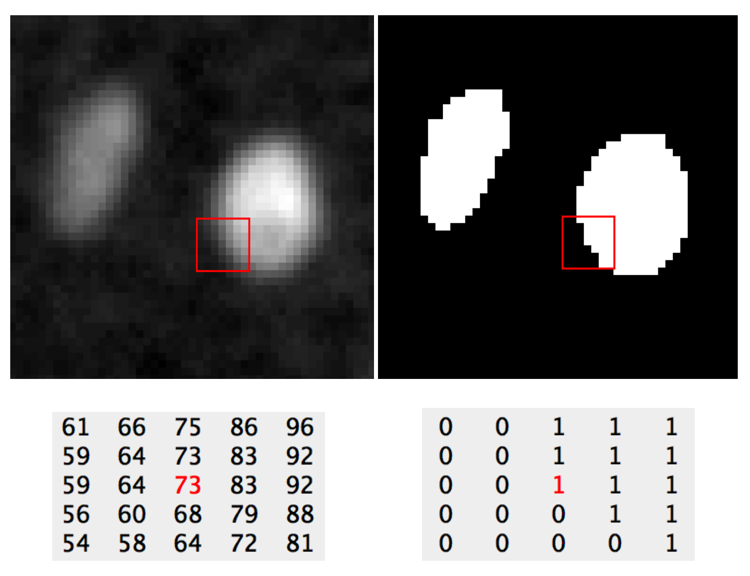
Figure
Image before and after applying a threshold of 73 gray values.
A common algorithm for binarization is thresholding. A threshold value t is chosen, either manually or automatically,
and all pixels with intensities below t are set to 0, whereas pixels with intensities >= t are set to the value for the foreground.
Depending on the software the foreground value can be different (e.g. 1 in MATLAB or 255 in ImageJ). At any pixel (x,y):
p_im(x,y) < t->p_bin(x,y) = 0
p_im(x,y) >= t->p_bin(x,y) = 1
where, p_im and p_bin are the intensity and binary images respectively.
For binarization, it is also possible to define an interval of threshold values, i.e. a lower and upper threshold value. Pixels with intensity values within this interval belong to the foreground and vice versa.
# %%
# Thresholding bright and dim cells
importnaparifrombioioimportBioImageimportmatplotlib.pyplotaspltimportnumpyasnp# from OpenIJTIFF import open_ij_tiff
# %%
# Load the image
# image, *_ = open_ij_tiff('https://github.com/NEUBIAS/training-resources/raw/master/image_data/xy_8bit__two_cells.tif')
img_obj=BioImage("https://github.com/NEUBIAS/training-resources/raw/master/image_data/xy_8bit__two_cells.tif")img=img_obj.data# %%
# Print the order of image dimensions
print(f'Axes order = {img_obj.dims.order}')# Open Napari Viewer
viewer=napari.Viewer()# %%
# View the image
viewer.add_image(img)# Add bounding boxes and colorbars for each channel
viewer.layers[0].bounding_box.visible=Trueviewer.layers[0].colorbar.visible=True# %%
# Napari: Inspect the pixel values to identify a threshold that segments both cells
# %%
# Inspect the image histogram to confirm the above threshold
plt.hist(img.flatten(),bins=np.arange(img.min(),img.max()+1));plt.yscale('log')# the background peak is so dominat that without the log scale it is hard to see the threshold
# %%
# Threshold the image and inspect the resulting values and data type
binary_image_two_cells=img>49print(np.unique(binary_image_two_cells))print(binary_image_two_cells.dtype)# %%
# Overlay the binary image
viewer.add_labels(binary_image_two_cells,opacity=0.8)# %%
# Apply a higher threshold
# to only select the brighter cell
# and also add this to the viewer
binary_image_one_cell=img>100viewer.add_labels(binary_image_one_cell,opacity=0.8)viewer.layer['binary_image_two_cells'].new_colormap()# to get a new (different) colormap
# %%
# Close the viewer (CI test requires this)
viewer.close()plt.close('all')
open("https://github.com/NEUBIAS/training-resources/raw/master/image_data/xy_8bit__PCNA.tif")selectWindow("xy_8bit__PCNA.tif");run("Duplicate...","title=[2 nuclei]");selectWindow("xy_8bit__PCNA.tif");run("Duplicate...","title=[boundary]");selectWindow("xy_8bit__PCNA.tif");run("Duplicate...","title=[dots]");selectWindow("2 nuclei");setThreshold(5,255);setOption("BlackBackground",true);run("Convert to Mask");selectWindow("boundary");setThreshold(4,4);setOption("BlackBackground",true);run("Convert to Mask");selectWindow("dots");setThreshold(44,255);setOption("BlackBackground",true);run("Convert to Mask");
# %%
# Nuclei, spots and nuclei boundary segmentation
importnapariimportnumpyasnpimportmatplotlib.pyplotasplt# from OpenIJTIFF import open_ij_tiff
frombioioimportBioImage# %%
# Read the intensity image
# image, *_ = open_ij_tiff('https://github.com/NEUBIAS/training-resources/raw/master/image_data/xy_8bit__PCNA.tif')
img_obj=BioImage("https://github.com/NEUBIAS/training-resources/raw/master/image_data/xy_8bit__PCNA.tif")img=img_obj.data# %%
# Print the order of image dimensions
print(f'Axes order = {img_obj.dims.order}')# Open Napari Viewer
viewer=napari.Viewer()# %%
# View the image
viewer.add_image(img)# Add bounding boxes and colorbars for each channel
viewer.layers[0].bounding_box.visible=Trueviewer.layers[0].colorbar.visible=True# %%
# Napari: Inspect the pixel values in order to identify a threshold
# %%
# Also check the image histogram for a threshold
# Observe that interestingly there are several local minima in the histogram
plt.hist(img.flatten(),bins=np.arange(img.min(),img.max()+1));plt.yscale('log')# %%
# Threshold both nuclei
# check the resulting datatype and content
# and view the binary image
binary_image_two_nuclei=img>5print(binary_image_two_nuclei.dtype)print(np.unique(binary_image_two_nuclei))viewer.add_labels(binary_image_two_nuclei,opacity=0.8)viewer.layers['binary_image_two_nuclei']# %%
# Apply a higher threshold
# to only segment the brighter nucleus
binary_image_one_nucleus=img>15viewer.add_labels(binary_image_one_nucleus,opacity=0.8)viewer.layers['binary_image_one_nucleus'].new_colormap()# to get a new (different) colormap
# %%
# Apply an even higher threshold
# to only select the intranuclear speckles
binary_image_speckles=img>44viewer.add_labels(binary_image_speckles,opacity=0.8)viewer.layers['binary_image_speckles'].new_colormap()# to get a new (different) colormap
# %%
# Apply two thresholds (aka "gating")
# to only select the boundary of cells
binary_image_boundary=(img<5)&(img>=4)viewer.add_labels(binary_image_boundary,opacity=0.8)viewer.layers['binary_image_boundary'].new_colormap()# to get a new (different) colormap
# %%
# Close the viewer (CI test requires this)
viewer.close()plt.close('all')
Measure the mean m and standard deviation s of the intensity in a backgroun region.
Set the threshold as t = m + N*s choosing some N larger than 1; N effectively determines the statistical significance with which the values above t are foreground pixels.