When you read your code again in six months from now, you want to understand what your code does, and why. Also if you would pass your code to another person, for them to use, modify, and/or extend it. For this, you can add comments to your code, i.e. text which can be read by human, and is ignored by computer when it executes your code.
In addition, you can use comment to skip certain part of the code. For example, when you wrote testing code and later no longer need those.
Prerequisites
Before starting this lesson, you should be familiar with:
After completing this lesson, learners should be able to:
Understand the concept and purpose of commenting.
Comment properly what certain section of code.
Concept map
graph TD
ST("script text") --> CD("code")
ST("script text") --> CM("comment")
CD -->|read by| RC("computer")
CM -->|read by| RH("human")
CM -->|ignored by| RC("computer")
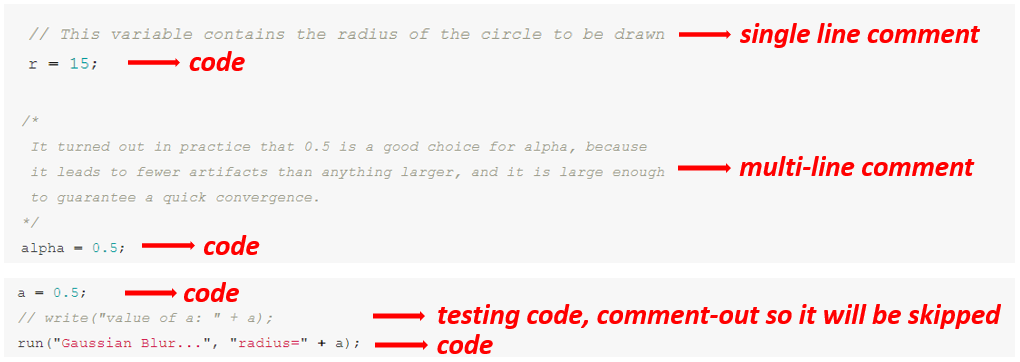
Figure
Single line comment, and multiple line (block) comment.
Activities
Expand the activity for different platforms.
Identify comment part or where it’s missing, and use that to understand the code.
Try to run the codes and see if it does what you expected. If necessary, add proper comment to further explain what certain part of code does.
Show activity for:
MATLAB
%These matlab scripts illustrate separating the foreground from the
%background using a threshold value provided by the user
%Prompt user for a threshold value
thres_val = input('Enter a threshold value: ');
% Prompt user to choose an image, e.g. xy_8bit__two_cells.tif
[file, path] = uigetfile("*.tif");
%Read input image
in_image = imread(fullfile(path, file));
%display input image
figure; imagesc(in_image);
%Binarize input image with the threshold valuein_image
bin_image = uint8(in_image>= thres_val);
% Display binary image
figure; imagesc(bin_image);
skimage napari
importmatplotlib.pyplotaspltfromOpenIJTIFFimportopen_ij_tiff# load the image from file
image_file="https://github.com/NEUBIAS/training-resources/raw/master/image_data/xy_8bit__two_cells.tif"image,_,_,_=open_ij_tiff(image_file)# binarize the image, so that all values larger than the threshold are foreground
threshold_value=60binarized=image>threshold_value# display the original and the binarized image
fig,ax=plt.subplots(2)ax[0].imshow(image)ax[0].set_title("Image")ax[1].imshow(binarized)ax[1].set_title("Binarized")# For associated course material in jupyter, go to https://nbviewer.jupyter.org/github/embl-bio-it/image-analysis-with-python/blob/carpentry/image-analysis-session/image-binarization.ipynb#Image-Binarization
# You can also spin up an interactive binder session: https://gke.mybinder.org/v2/gh/embl-bio-it/image-analysis-with-python/carpentry?filepath=image-analysis-session/image-binarization.ipynb
# %%
# Close the viewer (CI test requires this)
plt.close('all')