Imaging thick biological samples
When imaging thick samples, one needs to be aware that intensities are influenced by many factors, making intensity quantification in general very difficult. Measured intensities can be affected so much that even object shape measurements can become difficult. Already, the nature of the PSF makes measurements along the Z-direction different than in the XY plane, biological specimens can be more or less opaque (scattering, refracting index mismatch, absorption) making measurements deeper in the sample challenging. For all those reasons it is very important to understand the reasons for signal distortion. Not knowing those effects can easily lead to wrong measurements and conclusions.
Prerequisites
Before starting this lesson, you should be familiar with:
Learning Objectives
After completing this lesson, learners should be able to:
Understand that the geometry and optical properties of your biological specimen can have a large influence on the measured intensities
Concept map
Figure
Activities
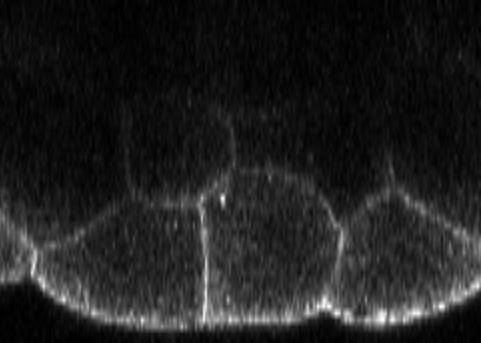
Confocal signal at membranes and inside a large specimen
- Open the zebrafish embryo confocal image
- Inspect the image along various axes and appreciate the following:
- Membranes appear with more contrast if they run along the optical axis
- Signal intensities become weaker to in the specimen’s interior, due to scattering and absorption
- Appreciate the cell segmentation (and morphometry) in the specimen interior are challenging/impossible
- Appreciate that intensity quantifications under such circumstances are highly challenging/impossible
Show activity for:
ImageJ GUI
- Open the mentioned image(s)
- Use
Plugins › BigDataViewer › Open Current Imageto inspect the image from different angles
- Use
Shift + Yto look along the y-axis- Use the mouse wheel to move along the y-axis
- Appreciate the mentioned effects on the membrane intensities
Assessment
Fill in the blanks
- In fluorescence microscopy the signal quality typically ___ when imaging deep inside a specimen.
- In confocal microscopy elongated structures that align with the z-axis typically appear ___ than elongated structures that align with the x or y-axis.
Solution
- decreases
- brighter
Follow-up material
Recommended follow-up modules:
Learn more: