Deriving scientifically sound conclusions from microscopy experiments typically requires batch analysis of large image data sets. Once the analysis has been conducted it is critical to visually inspect the results to identify errors and to make scientific discoveries. To do so efficiently requires making oneself familiar with appropriate tools.
Prerequisites
Before starting this lesson, you should be familiar with:
After completing this lesson, learners should be able to:
Use various tools to efficiently inspect segmented images and corresponding object measurements.
Concept map
graph TD
I("Images") --> BA("Batch analysis")
BA --> S("Segmentations")
S --> M("Object measurements")
I --> Q("Visual inspection")
S --> Q
M --> Q
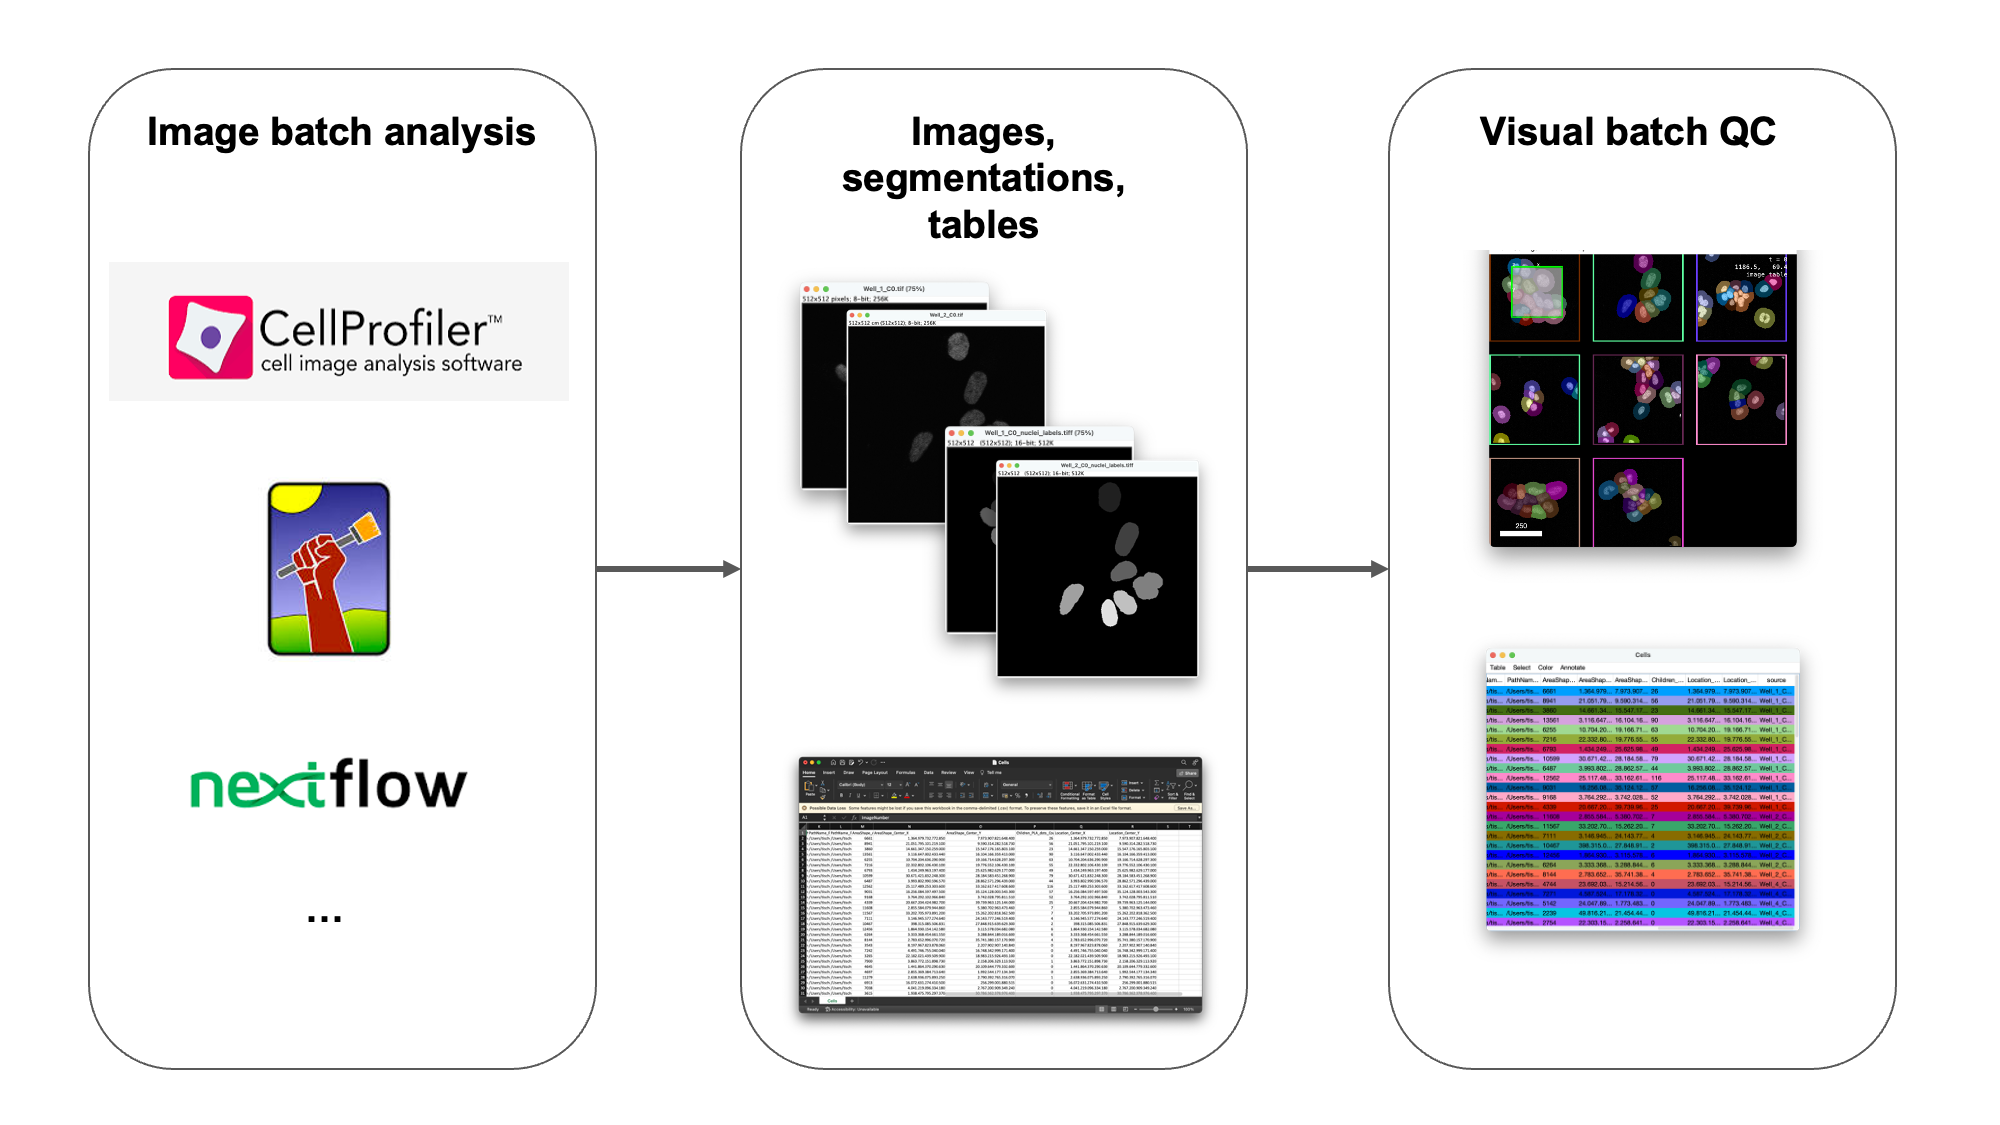
Figure
Depiction of a typical bioimage analysis workflow, where batch analysis of many input images yields object segmentation images and measurements, which must be quality controlled and explored for scientific discovery.
[ Plugins › MoBIE › Open › Open Image and Labels… ]
Image URI: [ Browse ] to a file ending with --raw.tif and then, to open all data, replace the text in the filename before --raw.tif by .* such that it reads .../.*--raw.tif (do not change the folder names)
Label Mask URI: [ Browse ] to a file ending with --tracking-oids.h5 and, as above, change the path to .../.*--tracking-oids.h5
Label Mask Table URI: [ Browse ] to a file ending with --tracking-table.csv and, as above, change the path to .../.*--tracking-table.csv
SpatialCalibration: UsePixelUnits; this is important, because the raw.tif images are calibrated, but, unfortunately, ilastik does not persist this calibration in the output data.
Grid: Transformed
Click [ OK ]
The MoBIE UI and BigDataViewer will open allowing you to conveniently browse all data
Browsing suggestions
Table menu: Color by Column: lineage_id with glasbey
Use the BDV time slider to go through the movie
Look for particular shape measurements and check that the appearance of the worm corresponds to this