Optical sectioning
The signal (e.g. photons) from a plane that is in focus gives a crisp and well resolved image. Unfortunately, we may also get photons from planes that are not in focus and this deteriorates the quality of the image (blur). Optical sectioning describe the ability of an imaging system to isolate a thin plane of interest within a 3D specimen and reject (or avoid) out of focus light.
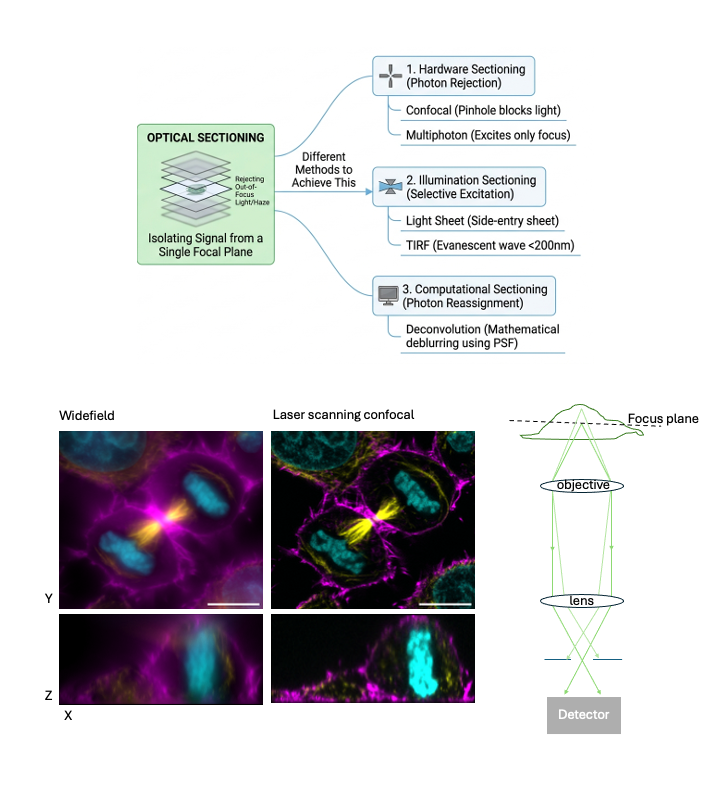
Technically there are different ways to achieve optical sectioning (pinhole in the detection, selective plane illumination, multi-photon). We can also use post-acquisition computational methods to reassign out-of-focus light, i.e. deconvolution.
Prerequisites
Before starting this lesson, you should be familiar with:
Learning Objectives
After completing this lesson, learners should be able to:
Understand the effect of optical sectioning in an image
Concept map
SECTIONING} %% 2. The Three Main Categories OS --> Hardware[1. Hardware Sectioning
Photon Rejection] OS --> Illumination[2. Illumination Sectioning
Selective Excitation] OS --> Computational[3. Computational Sectioning
Photon Reassignment] %% 3. Specific Methods subgraph Methods [Specific Implementations] Hardware --- Confocal["Confocal (Pinhole)"] Illumination --- LSFM["Light Sheet (LSFM)"] Illumination --- TIRF["TIRF (Evanescent wave)"] Computational --- Decon["Deconvolution (PSF-based)"] end
Figure
Activities
No optical sectioning in widefield microscopy
Depending on the microscopy method, one collects light from outside the current focal plane. In this activity, we will see this effect by comparing wide-field and confocal microscopy images of the same sample.
- Example data:
- Z-Stack with two “channels”, namely the same nucleus imaged with confocal and widefield fluorescence microscopy: xyzc_16bit__dna_conf_wf.tif
- Observe that a widefield image has the following properties:
- Depending on the z-position, different structures appear crisp
- However, the sum intensity in the image does (ideally) not depend in the z-position
- The latter has severe consquences for intensity measurements, namely wide-field microsopy is great to measure the total sum intensity of an object, but cannot be used to compare intensities at different z-positions
- This is very different from a confocal image, where the pinhole serves to only collect light at the current z-position
Show activity for:
ImageJ GUI
- Open the example image
- Place a ROI around the object in the image
- Use
Image › Stacks › Plot Z-axis Profileto measure the mean intensity at each z-position- Compute the change in intensity in percent from the brightest to the dimmest plane:
%change = 100% * (max - min) / (max - bg)
- Do this for both the confocal and the wide-field channel and compare the results
- Repeat, now using a much larger ROI such that all the blurred wide-field signal is always included in all z-planes
Assessment
Fill in the blanks
- In fluorescence microscopy the signal quality typically ___ when imaging deep inside a specimen.
- In wide-field fluorescence microscopy there is no ___ and thus signal intensity quantifications for one specific z-position are typically not possible.
Solution
- decreases
- optical sectioning
Follow-up material
Recommended follow-up modules:
Learn more: